A comment I often hear from chemistry teachers is that they are deeply interested in teaching students about climate change, but don’t see how it relates to chemistry. One might argue that climate change is all chemistry, but there are some really great places where the IPCC report is a natural fit for a chemistry class.
Where is a good place to start? How about ocean acidification?
NOAA has a great video explaining ocean acidification and its effects on shelled sea animals:
This matches well with the IPCC report’s figure SPM.4
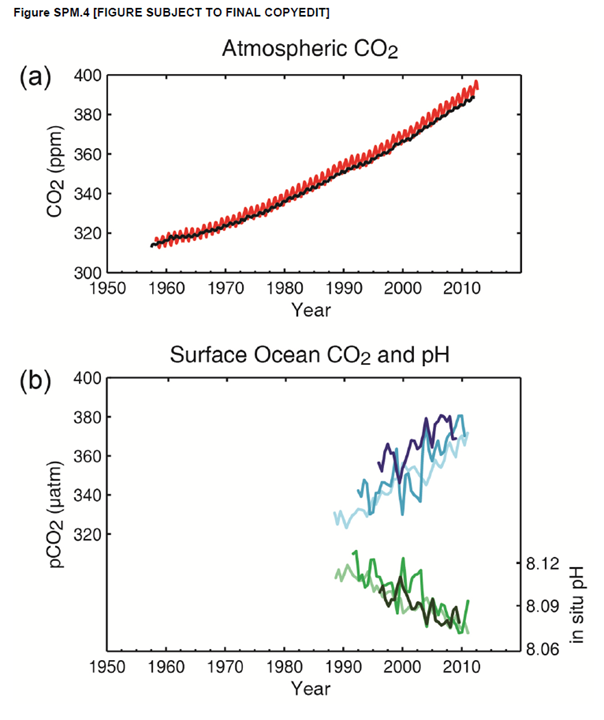
Caption: Multiple observed indicators of a changing global carbon cycle: (a) atmospheric concentrations of carbon dioxide (CO2) from Mauna Loa (19°32′N, 155°34′W – red) and South Pole (89°59′S, 24°48′W – black) since 1958; (b) partial pressure of dissolved CO2 at the ocean surface (blue curves) and in situ pH (green curves), a measure of the acidity of ocean water. Measurements are from three stations from the Atlantic (29°10′N, 15°30′W – dark blue/dark green; 31°40′N, 64°10′W – blue/green) and the Pacific Oceans (22°45′N, 158°00′W − light blue/light green).
But how could you teach about this topic? There are ample resources, for all age groups, on the CLEAN website.
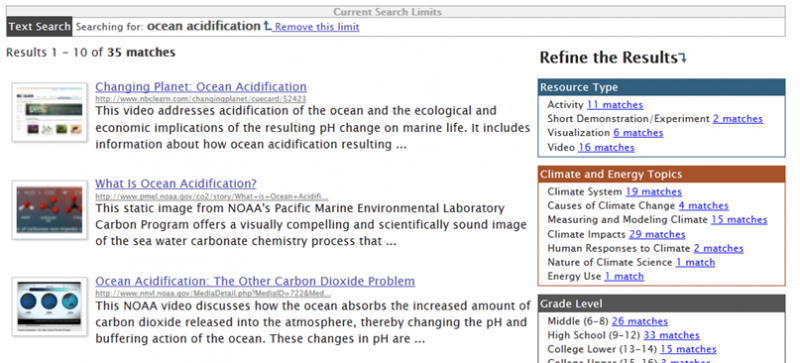
This searchable database has scientist-and-teacher-vetted educational materials, videos, and lesson plans for simple implementation in your class.